


"Growth and Value investing are joined by the hip." Warren Buffett
Surprised to find that it was...

A friend of mine asked me about growth and value investing. He found articles like “Brace Yourself For The Great Growth To Value Rotation,” “Wall Street Hails the Great Stock Rotation (Just Like Last Year),” and “Value vs. Growth Investing: Which Should You Buy?”; and asked my take. Having been intrigued, I did a little digging.
(This entry is not meant to be an investment advise. Please invest at your own risk. Past performance is not indicative of future returns. This entry is for information sharing only.)
My findings based on the US equity data is;
The longer you invest in Growth, the higher the upside potential than Value, but the downside risk does not change much with the investment horizon.
The longer you invest in Value, the upside potential lags Growth while the downside risk decreases.
I picked Russell 3000® Index1 as the benchmark for this project, as “[t]he Russell 3000® Index measures the performance of the largest 3,000 US companies representing approximately 97% of the investable US equity market” and it has a Russell 3000® Growth Index and a Russell 3000® Value Index.2
In the long run, the two indices has similar performances as seen below. Sometimes Growth do better than Value and vice versa.

Since the dip of the market in March 2020, Growth has outperformed Value but it seems that the trend reversed, hence the furry of articles as above.

So what constitutes the indices? Here is the breakdown from FTSE Russell’s fact sheets.
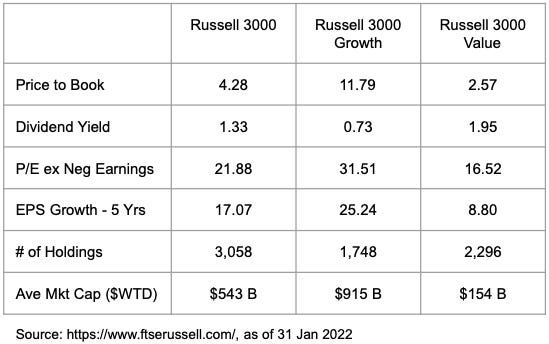
There are 3,058 stocks included in Russell 3000® Index, 1,748 in Russell 3000® Growth Index (“Growth Index“) and 2,296 stocks in Russell 3000® Value Index (“Value Index“). 1,748 + 2,296 does not total 3,058. I asked FTSE Russell and they confirmed that there are some companies included in both indices.3
It is clear that based on their methodology, the growth index has a lower dividend yield, higher price to earnings (P/E) excluding negative earnings, and higher earnings per share (EPS) growth. The value index has the reverse.4
Since I would like to invest longer than 1 year, I compared the 12 month rolling return of Growth Index and Value Index.


The Value Index 12 months rolling return had a maximum of 58% while Growth index was 64%. What was interesting at this point was that the minimum returns and the average returns do not differ much.
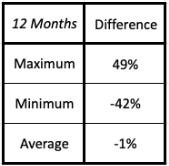
As the chart is a bit messy, I subtracted Growth Index returns from the Value Index returns. When the difference is positive, Value does better than Growth.

Just before the year 2000, tech stocks surged, then the bubble bursted and the fortune reversed. A similar Growth tilt was seen in 2019, before COVID-19 spread globally.5
The difference itself has a maximum (Value better) and a minimum (Growth better) of around 40%+ at certain points of time, but on average the 12 month rolling return difference is almost flat.
What gets interesting is when you increase the rolling period from 1 year to 5 or 10 years.

The minimum rolling return of 1 year Growth index is -45%, as per the previous chart. 5 year Growth index is -44% and for 10 years -42%, not so different from the 1 year minimum return. This means that even if you held the position for 10 years, depending on when you started investing, you had a chance that the minimum return did not differ from holding the investment for 1 year or 5 years.
For the Value index, the minimum return figures for 1 year, 5 year, and 10 year are -47%, -29% and -8%. The longer you are invested in Value, the lower the downside risk.
The Maximum Returns increase as the holding period increases, regardless of the investment style but, clearly, Growth had a higher maximum return than Value.
The other interesting observation is that although Growth had a slight edge, average returns did not differ too much between Growth and Value. This might be what Mr. Buffett was saying that Growth and Value investing was joined at the hip.
My personal conclusion is the following.
You can do really well with Growth if you can time it right.
Value investing for the long term will reduce your downside risk with a sacrifice of the upside potential compared to Growth.
Two investment gurus that I admire had some interesting things to say about investing and I think they represent their investment style.
Thomas Rowe Price Jr. (growth investor, founder of T. Rowe Price) quote
"No one can see ahead three years, let alone five or ten. Competition, new inventions—all kinds of things—can change the situation in twelve months."
Warren Buffett (value investor) quote
"Our favorite holding period is forever."
“https://www.ftserussell.com/” Data as of 31 January 2022.
The inception date of Russell 3000® index is 1 January 1984, and although the inception date of Russell 3000® Growth Index and Russell 3000® Value Index are both 1 July 1995, my analysis is from 1 January 1984 as it was available from Bloomberg. Bloomberg does provide data going back to January 1979. The data is on a back-tested basis.
I guess the overlapping companies can be categorised as “Growth at Reasonable Price,” or “GARP,” and could be an interesting study to analyse how they behave.
FTSE Russell’s official definition according to their fact sheets as follows.
“The Russell 3000® Growth Index measures the performance of the broad growth segment of the US equity universe. It includes those Russell 3000 companies with relatively higher price-to-book ratios, higher I/B/E/S forecast medium term (2 year) growth and higher sales per share historical growth (5 years).”
“The Russell 3000® Value Index measures the performance of the broad value segment of the US equity value universe. It includes those Russell 3000 companies with relatively lower price-to-book ratios, lower I/B/E/S forecast medium term (2 year) growth and lower sales per share historical growth (5 years).”
No, I am not implying anything artificial regarding the origin or spread of COVID-19.